Building a Donation Tracker Widget with Scriptable
Every year, coinciding with Childhood Cancer Awareness month, the Relay FM podcast network does a “Podcastathon” to raise funds for St. Jude Children’s Research Hospital. (You can donate now at stjude.org/relay!)
With many donation milestones and incentives along the way to their goal, many community members are stepping up to make donation trackers. My friend Matt VanOrmer made a special command for his FeedbackBot in the Relay FM Members Discord and an iOS widget in Python using Pyto. I decided to take on the challenge of making my own version of Matt’s widget using JavaScript with Scriptable. Scriptable allows us to build real iOS user interfaces, including widgets, by writing JavaScript directly on device, and seems like the perfect tool for this job.
Let’s get started.
Getting the data
Relay is using Tiltify to track their donations. Luckily for us, Tiltify has APIs that we can use to access data on campaigns.
Here’s how we’re making the request with GraphQL:
const req = new Request('https://api.tiltify.com');
req.headers = {
  'Content-Type': 'application/json'
};
req.method = "POST";
req.body = JSON.stringify({
	"operationName": "get_campaign_by_vanity_and_slug",
	"variables": {"vanity": "@relay-fm", "slug": "relay-st-jude-21"},
	"query": `query get_campaign_by_vanity_and_slug($vanity: String, $slug: String) {
  campaign(vanity: $vanity, slug: $slug) {
    id
    name
    slug
    status
    originalGoal {
      value
      currency
    }
    team {
      name
    }
    description
    totalAmountRaised {
      currency
      value
    }
    goal {
      currency
      value
    }
    avatar {
      alt
      height
      width
      src
    }
    milestones {
      id
      name
      amount {
        value
        currency
      }
    }
  }
}`
});
let body = await req.loadJSON();
Within our GraphQL query, we’re requesting many fields including the campaign’s name, its goal, how much has been raised so far, and any milestones set along the way to the goal. This API request returns to us a JSON object that mimics what our GraphQL query looks like:
{
  "data": {
    "campaign": {
      "avatar": {
        . . .
      },
      "goal": {
        "currency": "USD",
        "value": "333333.33"
      },
      "milestones": [
        {
          "amount": {
            "currency": "USD",
            "value": "20000.00"
          },
          "id": 127775,
          "name": "Myke and Stephen attempt Flight Simulator again"
        },
        . . .
      ],
      "id": 121745,
      "slug": "relay-st-jude-21",
      "status": "published",
      "team": null,
      "description": ". . .",
      "totalAmountRaised": {
        "currency": "USD",
        "value": "19065.66"
      },
      "name": "Relay FM for St. Jude 2021",
      "originalGoal": {
        "currency": "USD",
        "value": "100"
      }
    }
  }
}
Now, we can use this data to build a widget…
Building the widget
Scriptable lets us build widgets as a list of elements, declared one after another. Let’s start by creating the ListWidget object and set a gradient. Scriptable’s LinearGradient class allows us to build a more vibrant background. Here, I’m making a gradient of two colors (each set by their RGB hex code), and setting its location to run top to bottom:
const primaryTextColor = new Color("#efefef");

const widget = new ListWidget();
widget.setPadding(8, 15, 8, 10);

// widget background
const gradient = new LinearGradient();
gradient.colors = [
    new Color(`#dcb748`),
    new Color(`#d6aa29`)
];
gradient.locations = [0.0, 1];
widget.backgroundGradient = gradient;

widget.url = "https://stjude.org/relay";
Now we can start adding elements to our widget. Let’s add a big title using the name we got from Tiltify. We can set its text as well as a few variables like color and font style. Additionally, let’s add a spacer element after the text to keep our widget looking nice:
const titleText = widget.addText(body.data.campaign.name);
titleText.textColor = primaryTextColor; // primaryTextColor set in earlier code block
titleText.font = Font.boldSystemFont(24);

widget.addSpacer(8);
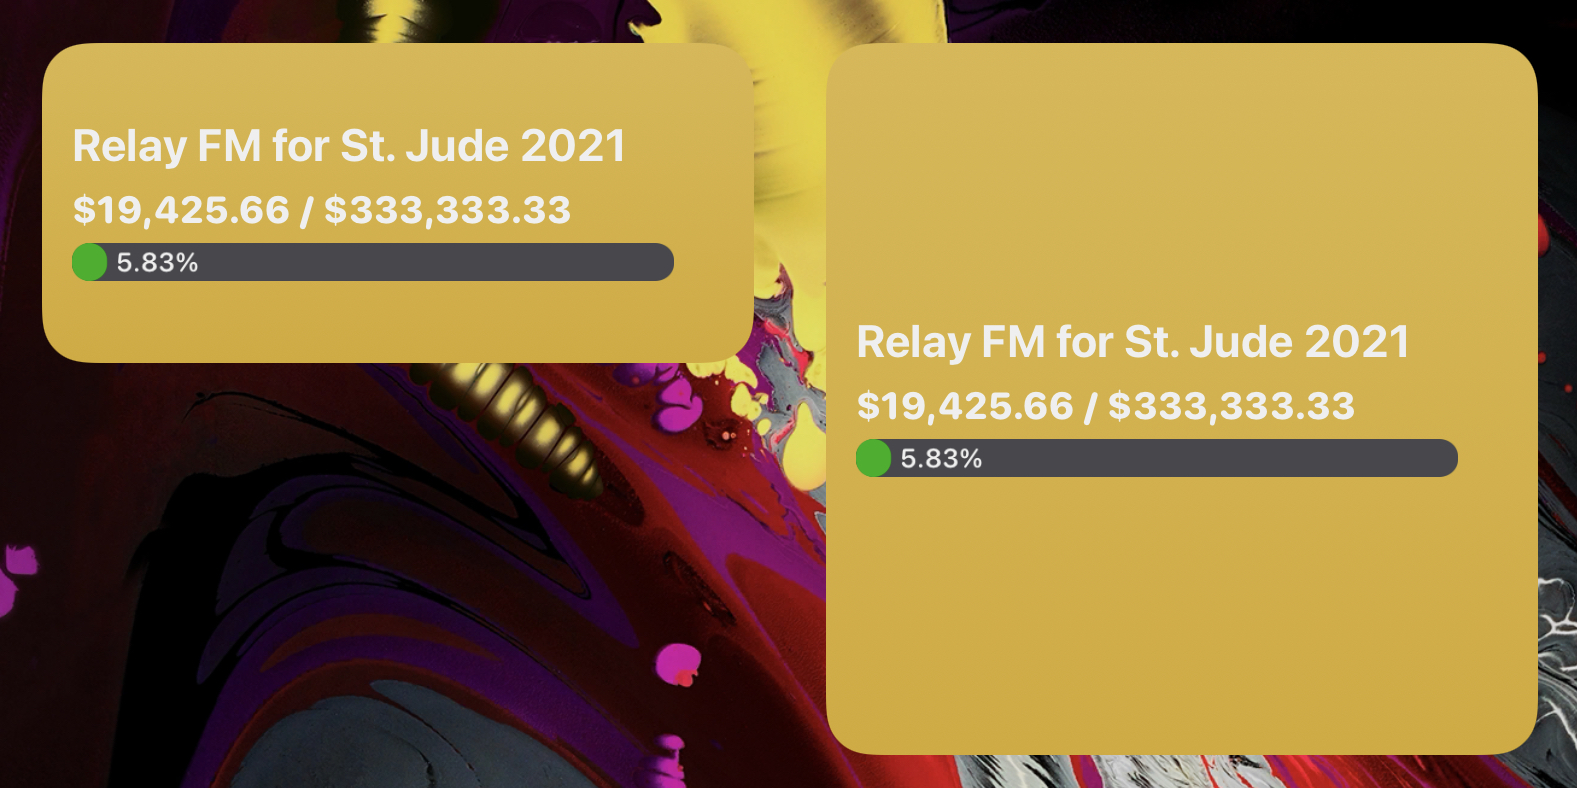
And finally we get to the good stuff: the actual donation total! Lets add a text element which shows both the total so far as well as the current campaign goal. Tiltify gives them to us as ready-to-go strings, but I’ve converted them to numbers here and back using toLocaleString() to get proper comma separated number formatting:
const soFar = parseFloat(body.data.campaign.totalAmountRaised.value);
const total = parseFloat(body.data.campaign.goal.value);

const amountText = widget.addText(`$${soFar.toLocaleString()} / $${total.toLocaleString()}`);
amountText.textColor = primaryTextColor;
amountText.font = Font.heavyRoundedSystemFont(20);

widget.addSpacer(6);
But I think we can do better than just text. Why not add a progress bar to visually show the donation total?
Adding a Progress Bar
To render our progress bar, we need to programmatically create an image to visualize the donation total. Let’s make a function that will handle this creation.
This function will use a DrawContext to handle the layout of our visual elements. These are done in absolute points, as opposed to stacking vertically like ListWidget. Here, we’re creating two rounded rectangles. The first, bgPath, will fill our entire width and height as specified, with rounding at about half the height. The second, fgPath will only be as wide as the percentage of donations that have been received towards the campaign’s gaol. We’ve placed these bars such that fgPath is drawn in front of bgPath, which will give us a nice looking progress bar:
const width = 320;

function createProgressBar(total, soFar, height, showPercentage = false) {
    const context = new DrawContext();
    context.size = new Size(width, height);
    context.opaque = false;
    context.respectScreenScale = true;

    // bar background
    context.setFillColor(new Color("#48484b"));
    const bgPath = new Path();
    bgPath.addRoundedRect(new Rect(0, 0, width, height), height / 2, (height / 2) - 1);
    context.addPath(bgPath);
    context.fillPath();

    // bar foreground
    context.setFillColor(new Color("#00b100"));
    const fgPath = new Path();
    fgPath.addRoundedRect(new Rect(0, 0, (width * soFar)/total, height), height / 2, (height / 2) - 1);
    context.addPath(fgPath);
    context.fillPath();
To finish off the progress bar, let’s add a text label to, optionally, show the percentage raised as as string. We can overlay this on top of the progress bar for a cool look. The text drawing functions for DrawContext are similar to what we used when adding text to our ListWidget, but do have some of their own syntax to deal with the positioning.
    if (showPercentage) {
        const percentage = ((soFar / total) * 100).toFixed(2);
        let xPos = (width * soFar)/total + 5;
        // if over 70%, show in foreground area
        // to ensure that it doesn't overflow the display
        if (percentage > 70) {
            xPos = (width * soFar)/total - 55;
        }

        context.setFont(Font.semiboldRoundedSystemFont(14));
        context.setTextColor(primaryTextColor);
        context.drawText(`${percentage}%`, new Point(xPos, (height / 14)));
    }

    return context.getImage();
}
Finally, lets add our progress bar image to our widget:
const progressBar = widget.addImage(createProgressBar(total, soFar, 20, true));
progressBar.imageSize = new Size(width, 20);

widget.addSpacer(4);
With that, you now have a fully functional widget. Let’s take a look:
But our large widget is looking a little empty. What if we could add some milestone progress bars to fill that up?
Adding Milestones
Tiltify gives us the campaign’s milestones as an array, which allows us to create a progress bar for each milestone by simply looping through it. We can also allow the user to choose how many milestones are displayed by using the widget parameter field:
// only show as many milestones as the user requests
// (1 looks good on a medium widget, 3 or 4 on a large)
let maxMilestones = args.widgetParameter;
let milestonesDisplayed = 0;
// progress bars for milestones
for (let milestone of body.data.campaign.milestones) {
    if (maxMilestones != undefined && milestonesDisplayed >= maxMilestones) {
        break;
    }
The rest of this loop should look pretty familiar to what we were making before: we’re adding text and progress bars to our widget. Here, though, we’re combining two text elements into a stack, which allows us to place the milestone name side-by-side with its percentage in a different font. We’ve also added a conditional such that we’re only adding milestones with less than 100% progress. This ensures we’re only showing milestones that are relevant to the current total:
    // calculate milestone percentage
    const milestoneTotal = parseFloat(milestone.amount.value);
    const percentage = (soFar / milestoneTotal) * 100;

    // if the milestone is long past, no need to show it
    if (percentage < 110) {
        widget.addSpacer(6);

        // a stack will let us put the name and percentage side by side
        const stack = widget.addStack();
        stack.spacing = 4;

        // milestone name
        const milestoneNameText = stack.addText(milestone.name);
        milestoneNameText.textColor = primaryTextColor;
        milestoneNameText.font = Font.boldSystemFont(16);
        milestoneNameText.lineLimit = 2;

        // milestone percentage
        const percentageFixed = percentage.toFixed(2);
        const percentageText = stack.addText(`${percentageFixed}%`);
        percentageText.textColor = primaryTextColor;
        percentageText.font = Font.regularRoundedSystemFont(16);

        widget.addSpacer(6);

        // milestone progress bar
        const milestoneProgressBar = widget.addImage(createProgressBar(milestoneTotal, soFar, 10, false));
        milestoneProgressBar.imageSize = new Size(width, 10);

        milestonesDisplayed += 1;
    }
}
Let’s see how that looks:
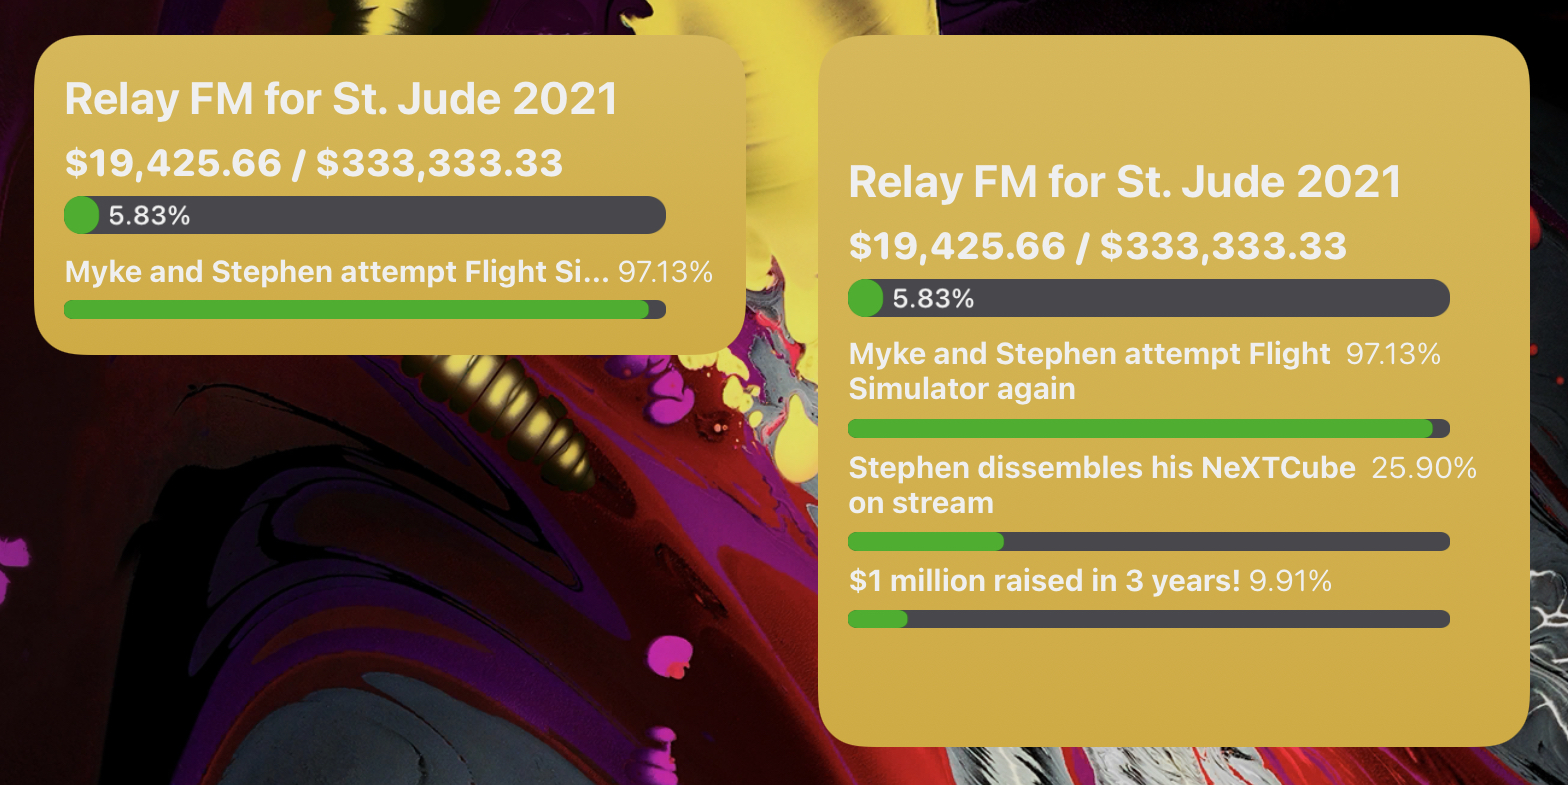
Looking good! I think that’s much nicer than our older large widget.
Try It Yourself!
You can download this script to use on your own device from my GitHub repository. You’ll need Scriptable to run it. I hope you enjoy it. Let me know if you have any suggestions for further improvements.
Credit Where It’s Due
As I said at the start, this project was hevilly inspired by Matt VanOrmer’s FeedbackBot command in the Relay FM Members Discord and Pyto widget. Additionally, I based some of my code (especially the progress bar) on Juniorchen2012’s widget from the Scriptable gallery.